How to Integrate New Relic Dashboard with Django

This step by step guide of adding new relic to django project will give you overall insights of your application logs and resource monitoring. Now you will know how to integrate new relic dashboard with Django
New Relic is all in one choice for monitoring and logging dashboard. Adding this to a Django project is like giving yourself a super charged insight of your django application. You can see each API call, any server error and create notifications or alerts for any of this monitoring data.
Lets dive to a step by step coding for adding new relic to django:
1. Create an account at new relic website. You can have a free account if you are using it for a personal project. This step is needed to get your license key. You can get it after login > your profile > API Keys
2. Install python package for new relic (if you are using virtualenv then install this package after you activate your environment)
pip install newrelic3. Create a configuration file named as newrelic.ini at root directory of your project, and add following content into file:
[newrelic]
license_key =
app_name = django-test-application
distributed_tracing.enabled = true
monitor_mode = true
log_level = info
ssl = true
high_security = false
transaction_tracer.enabled = true
transaction_tracer.transaction_threshold = apdex_f
transaction_tracer.record_sql = obfuscated
transaction_tracer.stack_trace_threshold = 0.5
transaction_tracer.explain_enabled = true
transaction_tracer.explain_threshold = 0.5
error_collector.enabled = true
browser_monitoring.auto_instrument = true
thread_profiler.enabled = true

[newrelic:development]
monitor_mode = false

[newrelic:test]
monitor_mode = false

[newrelic:staging]
app_name = petdrifts-api (Staging)
monitor_mode = true

[newrelic:production]
monitor_mode = true
4. Use the following command to run your application (if you are using gunicorn, then place the front of gunicorn run command and you can also put this in front of manage.py command)
NEW_RELIC_CONFIG_FILE=newrelic.ini newrelic-admin run-program $YOUR_DJANGO_COMMANDe.g
NEW_RELIC_CONFIG_FILE=newrelic.ini newrelic-admin run-program python manage.py runserver 0.0.0.0:80805. Run a new relic agent to forward logs to you new relic dashboard:
If you have docker installed use following command
docker run \
-d \
--name newrelic-infra \
--network=host \
--cap-add=SYS_PTRACE \
--privileged \
--pid=host \
-v "/:/host:ro" \
-v "/var/run/docker.sock:/var/run/docker.sock" \
-e NRIA_LICENSE_KEY=9899fabb2886c07a6278bfce550dce3ca685NRAL \
newrelic/infrastructure:latest
OR
If you want to run agent without docker
Linux
curl -Ls https://download.newrelic.com/install/newrelic-cli/scripts/install.sh | bash && sudo NEW_RELIC_API_KEY=NRAK-7V9WZMN09Q3Q6HQFGC9CN8GA04B NEW_RELIC_ACCOUNT_ID=3812700 /usr/local/bin/newrelic install -n logs-integrationWindows
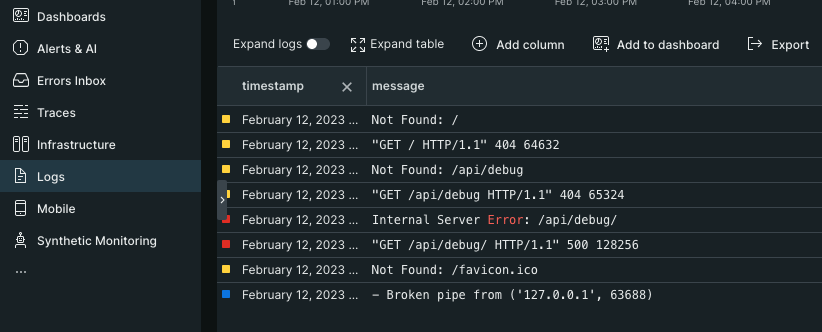
[Net.ServicePointManager]::SecurityProtocol = 'tls12, tls'; (New-Object System.Net.WebClient).DownloadFile("https://download.newrelic.com/install/newrelic-cli/scripts/install.ps1", "$env:TEMP\install.ps1"); & $env:TEMP\install.ps1; $env:NEW_RELIC_API_KEY='NRAK-7V9WZMN09Q3Q6HQFGC9CN8GA04B'; $env:NEW_RELIC_ACCOUNT_ID='3812700'; & 'C:\Program Files\New Relic\New Relic CLI\newrelic.exe' install -n logs-integrationVoila !! You are done. Now open you new relic dashboard and explore the magic of tracing. For logs, select the logs from the sidebar menu.


